
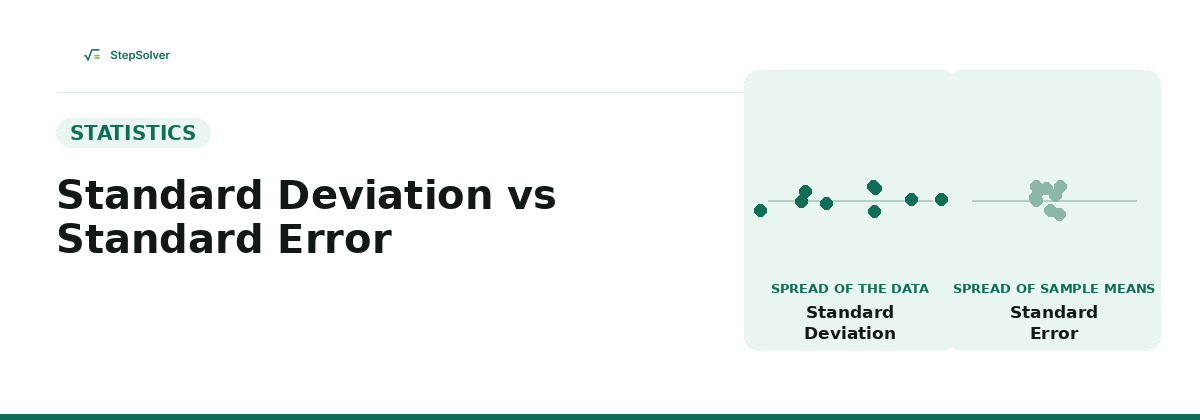
Standard deviation measures how spread out the individual values in your data are. Standard error measures how much a sample's mean would bounce around if you repeated the sampling process, an estimate of how close your sample mean is likely to be to the true population mean. They're calculated from the same numbers, but they answer two different questions, and mixing them up is one of the most common statistics mistakes in published research.
What Is Standard Deviation?
Standard deviation (σ for a population, s for a sample) describes the spread of the actual data points around the mean. If test scores have a standard deviation of 12, that tells you individual scores typically sit about 12 points away from the average score. Standard deviation doesn't change in any predictable way as you collect more data. It reflects a real property of the thing you're measuring, whether that's a set of test scores, plant heights, or delivery times, and stays roughly the same whether you measure 30 people or 3,000.
What Is Standard Error?
Standard error describes something different: the variability of the sample mean itself, not the variability of the raw data. Imagine repeating the same study 100 times, each time with a new random sample from the same population, and each time calculating the mean. Those 100 means wouldn't all be identical. Standard error estimates how much they'd typically differ from each other, and from the true population mean.
Unlike standard deviation, standard error shrinks as your sample size grows. A bigger sample gives you a more precise estimate of the population mean, so the "spread" of possible sample means gets tighter.
The Formula That Connects Them
Where s is the sample standard deviation and n is the sample size. Standard error is always standard deviation divided by the square root of the sample size, which is why it's always smaller than the standard deviation itself (for any sample larger than a single observation).
Worked Example
Suppose a sample of exam scores has a standard deviation of s = 10.
| Sample size (n) | Calculation | Standard error |
|---|---|---|
| 25 students | 10 / √25 = 10 / 5 | 2.0 |
| 100 students | 10 / √100 = 10 / 10 | 1.0 |
| 400 students | 10 / √400 = 10 / 20 | 0.5 |
Notice that the standard deviation of 10 doesn't appear anywhere in this table as a changing number, it's the same underlying spread in the data regardless of sample size. What changes is the precision of the mean estimate: with 400 students instead of 25, you can be substantially more confident that your sample's average score is close to the true average for the whole school.
When to Use Each
| Question you're answering | Use |
|---|---|
| "How spread out is my data?" | Standard deviation |
| "How precise is my estimate of the average?" | Standard error |
| Describing variability among individual subjects | Standard deviation |
| Building a confidence interval around a mean | Standard error |
| Comparing two group means in a hypothesis test | Standard error |
A common rule of thumb: if you're describing a population or sample directly, reach for standard deviation. If you're making a claim about how well your sample mean represents a larger population, standard error is almost always the more appropriate number, though it's frequently reported incorrectly in place of standard deviation in scientific papers and news coverage of studies.
You can compute standard deviation directly, along with the 68-95-99.7 rule and both population and sample formulas, using our Standard Deviation Calculator. For the concept standard deviation itself builds on, see our guide on what variance is.
Frequently Asked Questions
- Is standard error always smaller than standard deviation?
- Yes, as long as your sample has more than 1 observation. Since standard error equals the standard deviation divided by the square root of the sample size, and the square root of any n greater than 1 is greater than 1, dividing always shrinks the value. The two are only equal when n = 1.
- Does standard error tell you anything about individual data points?
- No. Standard error only describes how much a sample mean is likely to vary from the true population mean. It says nothing about how spread out the individual data points themselves are. For that, you need the standard deviation.
- Why does standard error get smaller with a bigger sample?
- Larger samples average out random noise more effectively. A single unusual value has less influence on the mean of 1,000 observations than on the mean of 10, so the sample mean becomes a more stable, reliable estimate of the true population mean as sample size grows, even though the underlying data's own spread (the standard deviation) doesn't change.
- Should error bars on a chart show standard deviation or standard error?
- It depends on what you want to show. Use standard deviation error bars to show how spread out the raw data is. Use standard error error bars (or a confidence interval) to show how precisely you've estimated the mean. Many published charts don't specify which one was used, which is a common source of confusion when comparing studies.
Related Articles
Read next: What Is Variance? Formula, Meaning & How to Calculate It, or browse all articles on the StepSolvers blog.