
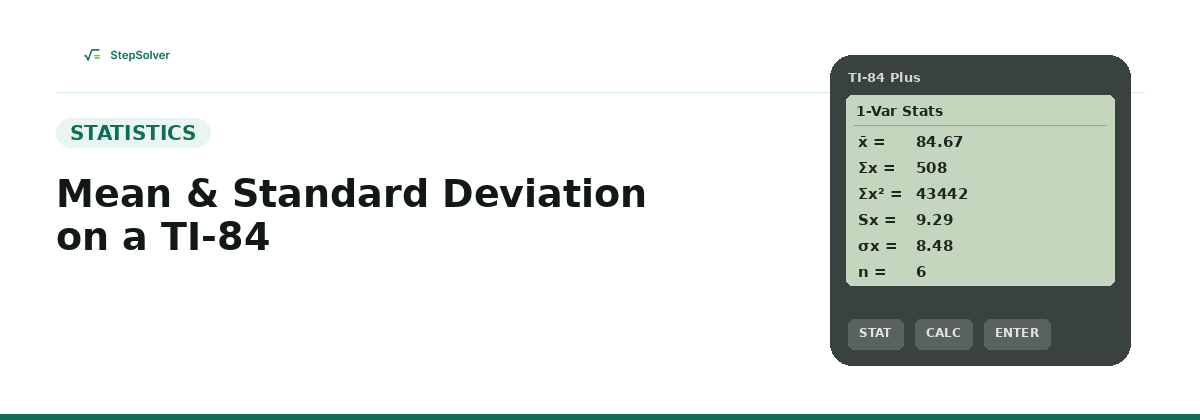
The TI-84 finds the mean and standard deviation of a data set with a single built-in function: 1-Var Stats. Enter your numbers into a list, run STAT → CALC → 1-Var Stats, and the calculator returns the mean, both the sample and population standard deviation, and several other summary values at once, no manual formula required.
Step-by-Step: Finding Mean and Standard Deviation on a TI-84
- Press STAT, then select 1:Edit to open the list editor.
- Under the L1 column, type each data value and press Enter after each one.
- Press STAT again, arrow over to the CALC menu, and select 1:1-Var Stats.
- If prompted for a list, confirm L1 (this is the default), then press Enter.
- Read the results directly off the screen. Scroll down with the arrow keys to see every value, since not everything fits on one screen at once.
Reading the Output
The TI-84 prints several labelled values. Here's what each one means:
| Symbol | Meaning |
|---|---|
| x̄ | The mean (average) of your data |
| Σx | The sum of all data values |
| Σx² | The sum of each value squared, used internally to calculate the standard deviation |
| Sx | Sample standard deviation (divides by n − 1) |
| σx | Population standard deviation (divides by n) |
| n | The number of data values entered |
The most common mistake is reading σx when the question calls for Sx, or the reverse. If your data is a sample meant to represent a larger population, which is true for most real-world data sets, use Sx.
Worked Example
Enter six test scores into L1: 78, 85, 92, 88, 95, 70. Running 1-Var Stats returns:
| Output | Value |
|---|---|
| x̄ | 84.67 |
| Σx | 508 |
| Σx² | 43442 |
| Sx | 9.29 |
| σx | 8.48 |
| n | 6 |
Notice that Sx (9.29) is always a little larger than σx (8.48) for the same data set. Dividing by the smaller number n − 1, instead of n, always produces a slightly bigger result.
Common Mistakes to Avoid
- Reading σx by habit. It's easy to default to whichever value appears first, but most classroom and real-world data sets are samples, so Sx is usually the one you want.
- Old data left in the list. If L1 still contains numbers from a previous problem, new entries get added to the old ones rather than replacing them. Clear the list first with STAT → 4:ClrList.
- Running 1-Var Stats on the wrong list. If your data is in L2 or L3, you must type the list name after the command (for example 1-Var Stats L2), or the calculator will read the default, empty L1.
If you'd rather see the full step-by-step working, not just the final calculator output, our Standard Deviation Calculator shows every stage of the calculation for both population and sample data. For the same calculation done in a spreadsheet instead, see how to calculate standard deviation in Excel, and for the concept standard deviation is built from, see our guide on what variance is.
Frequently Asked Questions
- What is the difference between Sx and σx on a TI-84?
- Sx is the sample standard deviation, dividing by n-1, and is the value to use when your data is a sample representing a larger population. σx is the population standard deviation, dividing by n, and should only be used when your data includes every member of the group. The TI-84 calculates both automatically every time you run 1-Var Stats, so you just read off the one you need.
- Why does my TI-84 show L2, L3 statistics I don't need?
- 1-Var Stats defaults to reading list L1 unless you specify otherwise. If your data is in a different list, type 1-Var Stats followed by the list name (for example 1-Var Stats L2) before pressing Enter. There's no need to clear other lists first.
- How do I clear old data from a list before entering new numbers?
- Press STAT, choose 4:ClrList, type the list name (for example L1), and press Enter. This empties the list without deleting it, so it's ready for new data.
- Can the TI-84 calculate standard deviation for grouped or frequency data?
- Yes. Enter your values in L1 and their frequencies (how many times each value occurs) in L2, then run 1-Var Stats L1, L2. The calculator will weight each value by its frequency automatically.
Related Articles
Read next: What Is Variance?, Standard Deviation vs Standard Error, How to Calculate Standard Deviation in Excel, or browse all articles on the StepSolvers blog.