
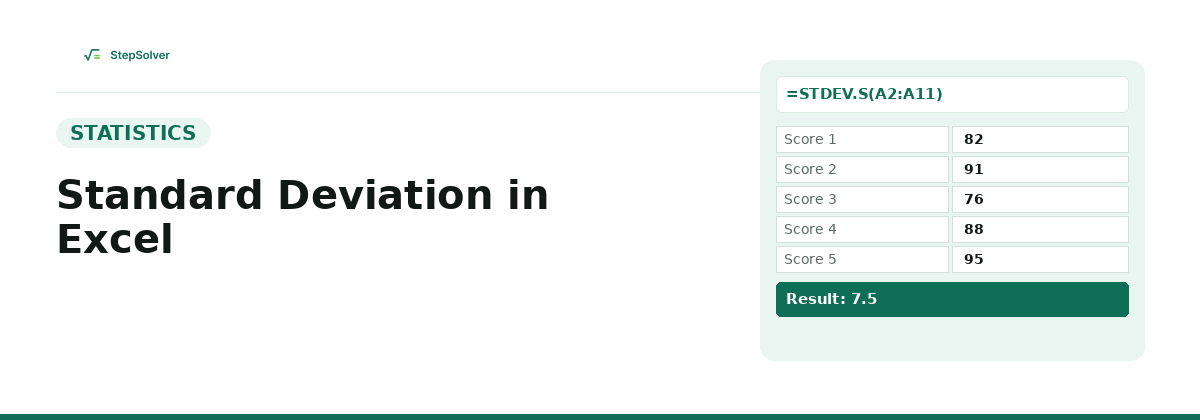
Excel calculates standard deviation with a single built-in function, no manual formula required. Use =STDEV.S(range) for a sample of data, or =STDEV.P(range) if your data covers an entire population. Type the formula into any empty cell, select your data range, and Excel returns the result instantly.
Which Excel Function Should You Use?
Excel has several standard deviation functions, and picking the wrong one is the single most common mistake people make with this calculation. The choice comes down to one question: does your data include every member of the group you care about, or just a sample of it?
| Function | Use when... | Divides by |
|---|---|---|
| STDEV.S | Your data is a sample representing a larger population (most common case) | n − 1 |
| STDEV.P | Your data includes every member of the group, nothing is being estimated | n |
| STDEV | Legacy version of STDEV.S, kept only for old spreadsheet compatibility | n − 1 |
| STDEVP | Legacy version of STDEV.P, kept only for old spreadsheet compatibility | n |
For a new spreadsheet, use STDEV.S or STDEV.P. The legacy STDEV and STDEVP still work and return identical results, but Microsoft recommends the newer names going forward.
Step-by-Step: Calculating Standard Deviation in Excel
- Enter your data into a column, one value per cell (for example, cells A2 through A6).
- Click an empty cell where you want the result to appear.
- Type
=STDEV.S(A2:A6)for a sample, or=STDEV.P(A2:A6)for a full population, adjusting the cell range to match your actual data. - Press Enter. Excel calculates the result immediately.
Worked Example
Take five test scores: 82, 91, 76, 88, and 95, entered in cells A2 through A6. Since this is a sample of a class's scores rather than every student who ever took the test, the sample function is the right choice:
| Cell | Value |
|---|---|
| A2 | 82 |
| A3 | 91 |
| A4 | 76 |
| A5 | 88 |
| A6 | 95 |
Excel handles the entire calculation, finding the mean (86.4), the squared deviation of each value from it, and the square root of their average, without you needing to build out any of those intermediate steps yourself.
Common Mistakes to Avoid
- Using STDEV.P by default. Most real-world data (survey responses, a batch of test scores, measurements from a production run) is a sample, not a full population, so STDEV.S is correct far more often than STDEV.P.
- Including a header cell in the range. If row 1 contains a text label like "Score", starting your range at A1 instead of A2 won't break the formula (Excel ignores text), but it's easy to accidentally include a stray number from elsewhere in row 1.
- Selecting a range with only one value. STDEV.S divides by n − 1, so a single-value range causes a #DIV/0! error. You need at least two numbers.
If you'd rather see the full step-by-step working, not just the final Excel result, our Standard Deviation Calculator shows every stage of the calculation for both population and sample data. For the concept standard deviation is built from, see our guide on what variance is, and for the difference between describing your data versus estimating a mean, see standard deviation vs standard error.
Frequently Asked Questions
- What is the difference between STDEV.S and STDEV.P in Excel?
- STDEV.S calculates sample standard deviation, dividing by n-1, and should be used when your data is a sample meant to represent a larger population. STDEV.P calculates population standard deviation, dividing by n, and should be used only when your data includes every member of the group you care about.
- Should I use STDEV or STDEV.S in Excel?
- Use STDEV.S. STDEV is the older, legacy version of the same sample standard deviation function, kept only for compatibility with spreadsheets built in very old Excel versions. STDEV.S returns an identical result and is the version Microsoft recommends for any new spreadsheet.
- Why does Excel give a #DIV/0! error when calculating standard deviation?
- STDEV.S divides by n-1, so a range containing only one number (or one number plus blank cells) has no valid result and returns #DIV/0!. Make sure your selected range includes at least two numeric values.
- Does Excel's standard deviation function ignore text and blank cells?
- Yes. STDEV.S and STDEV.P both ignore blank cells and cells containing text automatically, only numeric values in the selected range are included in the calculation. You don't need to clean the range first.