
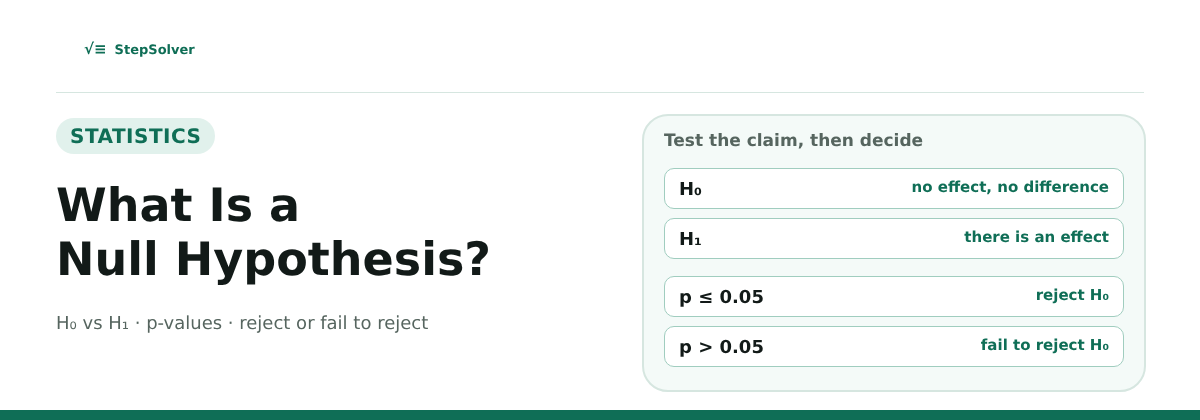
The null hypothesis is the starting assumption in a statistical test: nothing is going on, there is no effect and no difference. You collect data to see whether the evidence is strong enough to reject that assumption. This guide explains what it is, how to write one, and how to use a p-value to decide, with worked examples.
What Is a Null Hypothesis?
The null hypothesis, written H₀ ("H-naught"), states that there is no effect, no difference or no relationship in the population you are studying. The alternative hypothesis, written H₁ or Hₐ, states the opposite: that there is an effect, a difference or a relationship.
You never prove the alternative directly. You assume the null is true, then ask how likely your data would be if that were so. If the data would be very unlikely, you reject the null in favour of the alternative.
Null and Alternative Hypothesis Examples
| Question | Null hypothesis (H₀) | Alternative (H₁) |
|---|---|---|
| Is a coin fair? | p = 0.5 | p ≠ 0.5 |
| Is the average student height 170 cm? | μ = 170 | μ ≠ 170 |
| Does a new drug lower blood pressure more than a placebo? | μ(drug) = μ(placebo) | μ(drug) < μ(placebo) |
| Does a new teaching method raise test scores? | μ(new) = μ(old) | μ(new) > μ(old) |
| Are height and weight related? | ρ = 0 (no correlation) | ρ ≠ 0 |
How to Write a Null Hypothesis
- Turn the research question into a claim about the population, using population symbols such as μ (mean), p (proportion) or ρ (correlation).
- Write H₀ with an equals sign. The null always includes equality: =, ≤ or ≥.
- Write H₁ as the opposite, using ≠, < or >. It never includes equality.
- Choose one-tailed or two-tailed. Use ≠ (two-tailed) when you care about a difference in either direction. Use < or > (one-tailed) when you only care about one direction.
How a Hypothesis Test Works
- State H₀ and H₁.
- Choose a significance level α, usually 0.05. This is the risk you accept of rejecting a true null.
- Collect data and compute a test statistic such as z or t.
- Find the p-value: the probability of seeing results at least this extreme if H₀ were true.
- Decide. If p ≤ α, reject H₀. If p > α, fail to reject H₀.
To find a p-value from a test statistic, use the P-Value Calculator.
Worked Example: Reject the Null
A machine is supposed to fill bottles with a mean of 500 ml. The standard deviation is known to be 9 ml. A sample of 36 bottles has a mean of 497 ml. Test at α = 0.05.
- H₀: μ = 500 and H₁: μ ≠ 500 (two-tailed).
- Standard error = 9 ÷ √36 = 9 ÷ 6 = 1.5.
- z = (497 − 500) ÷ 1.5 = −2.0.
- Two-tailed p-value = 2 × P(Z < −2.0) = 2 × 0.0228 = 0.0455.
- 0.0455 is less than 0.05, so reject H₀.
Worked Example: Fail to Reject the Null
Same machine, but now the sample mean is 498.5 ml.
- z = (498.5 − 500) ÷ 1.5 = −1.0.
- Two-tailed p-value = 2 × P(Z < −1.0) = 2 × 0.1587 = 0.3173.
- 0.3173 is greater than 0.05, so fail to reject H₀.
"Fail to Reject" Is Not "Accept"
When the p-value is large, you do not prove the null is true. You only show that your data did not give strong enough evidence against it. A small sample can miss a real effect. That is why the correct wording is fail to reject H₀, not "accept H₀".
Type I and Type II Errors
| H₀ is actually true | H₀ is actually false | |
|---|---|---|
| Reject H₀ | Type I error (false positive), probability α | Correct decision |
| Fail to reject H₀ | Correct decision | Type II error (false negative), probability β |
Lowering α makes Type I errors less likely but Type II errors more likely. A larger sample reduces the chance of a Type II error.
Common Mistakes to Avoid
- Saying "accept the null". Say "fail to reject".
- Reading the p-value as the chance H₀ is true. It is the chance of data this extreme if H₀ were true.
- Choosing α after seeing the data. Set it before you test.
- Putting the claim you want to prove in H₀. The null should be the no-effect position, and your claim usually goes in H₁.
- Confusing a significant result with an important one. A tiny difference can be significant in a very large sample.
Practice Problems
- Write H₀ and H₁ for: "The average commute is 30 minutes."
- Write H₀ and H₁ for: "A new fertiliser increases crop yield."
- A test gives p = 0.03 with α = 0.05. What is the decision?
- A test gives p = 0.12 with α = 0.05. What is the decision?
- You reject a true null hypothesis. Which type of error is this?
Answers
- H₀: μ = 30 and H₁: μ ≠ 30.
- H₀: μ(new) = μ(old) and H₁: μ(new) > μ(old).
- 0.03 is below 0.05, so reject H₀.
- 0.12 is above 0.05, so fail to reject H₀.
- A Type I error.
Frequently Asked Questions
- What is a null hypothesis in simple terms?
- The null hypothesis is the default assumption that there is no effect, no difference or no relationship. A statistical test checks whether the data give enough evidence to reject it.
- What is the difference between the null and alternative hypothesis?
- The null hypothesis (H₀) says there is no effect. The alternative hypothesis (H₁ or Hₐ) says there is an effect, difference or relationship. They are opposites, so exactly one of them is true.
- When do you reject the null hypothesis?
- Reject H₀ when the p-value is less than or equal to your significance level α, usually 0.05. This means the data would be unlikely if the null were true.
- Why do we say fail to reject instead of accept?
- A large p-value only shows that the data did not provide enough evidence against H₀. It does not prove H₀ is true, because a small sample can miss a real effect.
- Does the null hypothesis always have an equals sign?
- Yes. H₀ always contains equality: =, ≤ or ≥. The alternative hypothesis uses ≠, < or > and never includes equality.
- What is a p-value?
- The p-value is the probability of getting results at least as extreme as yours if the null hypothesis were true. It is not the probability that the null hypothesis is true.
- What is a significance level?
- The significance level α is the risk you accept of rejecting a true null hypothesis, which is a Type I error. The most common choice is 0.05, meaning a 5% risk.