
A calculator can give you a standard deviation or a p-value in seconds. It can't tell you whether that was the right test to run. This guide covers how to pick the right statistical test before you calculate anything, with a worked example at the end.
Why the Wrong Test Is a Bigger Problem Than a Wrong Number
A t-test and a chi-square test check for different things. Run the wrong one and the arithmetic can still come out clean, every decimal correct, and the result still won't answer your research question. Examiners are trained to catch this. It's one of the most common reasons a methodology chapter gets sent back.
Matching the Question to the Test
Most dissertation questions fall into a handful of patterns, and each pattern has a standard test built for it. The pairings below cover the situations students meet most often.
| Your question | Standard test | Alternative if assumptions fail |
|---|---|---|
| Difference between two separate groups | Independent samples t-test | Mann-Whitney U test |
| The same people measured twice | Paired samples t-test | Wilcoxon signed-rank test |
| Difference across three or more groups | One-way ANOVA | Kruskal-Wallis test |
| Relationship between two continuous variables | Pearson correlation | Spearman's rank correlation (ordinal or skewed data) |
| Association between two categorical variables | Chi-square test of independence | – |
| Predicting one outcome from one or more variables | Linear regression (continuous outcome) | Logistic regression (categorical outcome) |
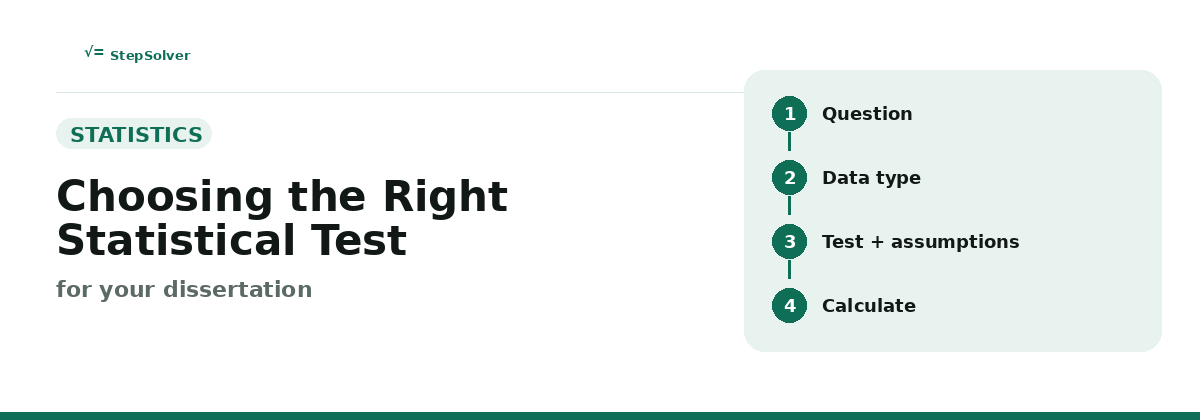
The Four Steps, in Order
| Step | What to do |
|---|---|
| 1 | Write out the research question in one sentence. |
| 2 | Decide what it's actually asking: a difference between groups, a relationship between variables, or a change over time. |
| 3 | Pick the test built for that question, then check your data meets its assumptions. |
| 4 | Run the numbers. Use a calculator to check the arithmetic, not to choose the method. |
Worked Example: Standard Deviation by Hand
Dataset: 4, 8, 6, 5, 7
Step 1: Find the mean. (4 + 8 + 6 + 5 + 7) / 5 = 6
Step 2: Subtract the mean from each value. −2, 2, 0, −1, 1
Step 3: Square each deviation and add them up. 4 + 4 + 0 + 1 + 1 = 10
Step 4: Divide by n−1 for a sample. 10 / 4 = 2.5 (this is the variance)
Step 5: Take the square root. √2.5 ≈ 1.58
Run the same five numbers through the Standard Deviation Calculator and you'll get the same 1.58, with every step shown. Worth doing once by hand so you know what the tool is actually checking.
Common Mistakes
- Picking the test after looking at the data, instead of before.
- Using a parametric test (like a t-test) on data that doesn't meet its assumptions, such as a normal distribution.
- Treating a significant p-value as proof the method was right. It isn't. It just means the test ran.
How to Check Your Assumptions
Every test comes with conditions that need to hold for the result to be trustworthy. Before running a parametric test, look at whether the data is roughly normally distributed. A histogram or a Q-Q plot gives a quick visual check, and the Shapiro-Wilk test gives a formal one. Check that each observation is independent of the others, which is usually a question of how the data was collected rather than something you calculate. For group comparisons, test whether the groups have similar variances, for example with Levene's test. Finally, think about sample size. Very small samples make assumption checks unreliable, and they are a good reason to talk to your supervisor before choosing a method.
How to Report Your Choice in the Methodology Chapter
Examiners want to see your reasoning, not just your output. State the research question, name the test, and explain in a sentence or two why it fits that question and that type of data. Report the assumption checks you ran and what they showed. Give the significance level you used, commonly 0.05, and report an effect size and confidence interval alongside the p-value, because a p-value alone says little about how large or meaningful a difference is. If you switched to a non-parametric alternative, say why. A clear justification here often matters more to a marker than the result itself.
Frequently Asked Questions
- How do I know which statistical test to use?
- Look at your research question and your data type. A supervisor or research methods textbook can confirm the right fit before you run anything.
- Can I use an online calculator for my dissertation stats?
- Yes, for single calculations and spot-checks. For a full dataset with multiple variables, most universities expect SPSS or similar software.
- What happens if I use the wrong test?
- You'll still get a number. It just won't mean what you think it means, and it's a common reason methodology chapters get sent back.
Related Reading
Full walkthrough of a dissertation data analysis chapter, SPSS included: dissertation data analysis guide.
Universities now check methodology and results chapters for AI-generated text too. Worth a scan before you submit: free AI content detector.
On StepSolvers: the P-Value Calculator converts a test statistic into a p-value, and our guide to standard deviation vs standard error covers two terms that are often confused in results chapters.